


Homographs Fun Deck app for iPhone and iPad
Developer: Super Duper Publications
First release : 29 Jan 2014
App size: 50.42 Mb
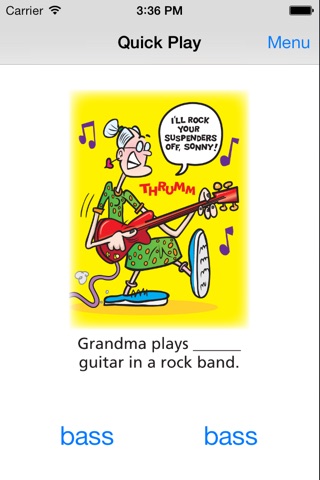
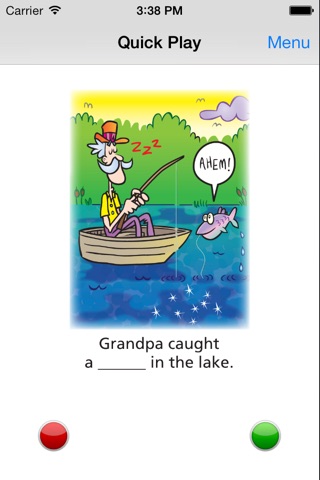
This educational vocabulary App for the iPhone®, iPad®, and iPod touch® has all 56 illustrated picture flash cards (plus audio of each card’s text) from the Homographs Fun Deck® by Super Duper® Publications. Select the cards you want students to see, and have your students fill in the blank to practice and learn about words that are spelled the same but pronounced differently and have different meanings. The prompts include statements like, “Doug cried a single tear” and “The cat’s claws might tear my sweater.” The Automatic Scoring option allows the students to choose from one of two answers to complete the sentence correctly.
Homographs Fun Deck® App App lets you:
• Use the app in portrait or landscape orientation.
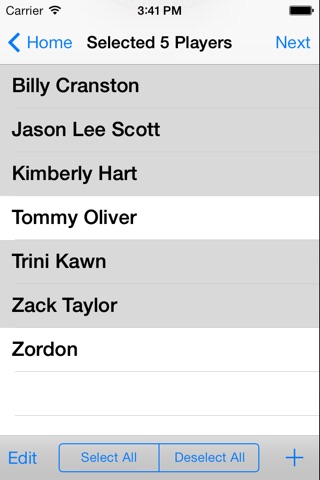
• Select all 56 cards or just the ones you want students to see.
• Track correct and incorrect responses for an unlimited number of players.
• Advance players and cards manually or automatically.
• Receive feedback for incorrect and/or correct responses
• Discontinue game play and continue at any time.
• View results in a graph and see which questions a player missed during a session.
• Print, e-mail, and share your results.
This App is simple to use — each student looks at an illustration and touches the screen to listen to the prompt and answer choices. The student then responds by touching his/her answer. Move to the next card by sliding the card currently on the display screen to the side. To move to the next player, tap the bar at the top of the screen and select a name. You can also advance cards and players automatically by selecting the Auto-Advance option in the Game Options menu. You can leave a game temporarily and return to it later by selecting Pause Game from the menu. To return to the game, select Continue Game from the main menu. When you finish, view the results in a graph, and print or email your data.